Viewers, colour scales and maps
The viewer strip and switches, the result board, tabs or tiles, linked viewers, legend limits, colour maps and plate results drawn as a 3D surface.
Results & reports 10 min read
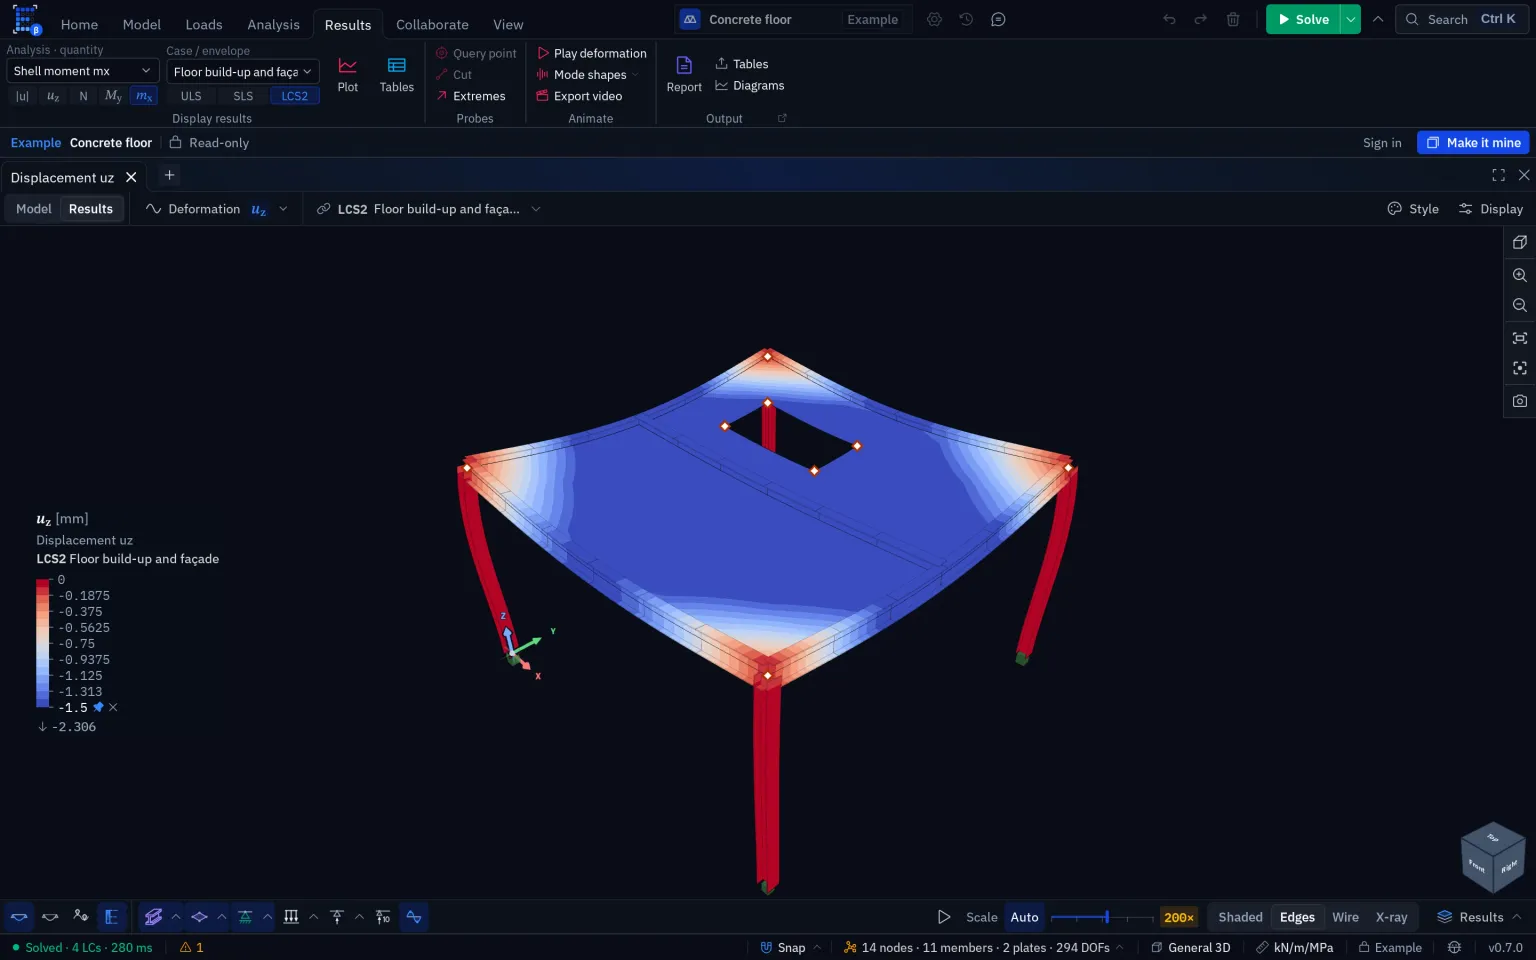
A viewer shows the model or one result quantity for one load state. Each viewer keeps its own quantity, load state, display settings and colour scale, so two viewers side by side can answer two different questions from the same solve. This page covers how to set one up and how to make several work together. What the plotted quantities mean is in Reading diagrams.
The viewer strip
One row above the viewer says what it shows:
- Model | Results — the model, or a result.
- The quantity — its family and component, for example Member forces My. Clicking it opens the result board.
- The load state — a load case, combination, envelope or mode for results; for the model, whose loads are drawn, with Auto first.
At the right end sit Link, shown only while another viewer is on screen (see Linked viewers), Style, shown only for results, and Display. In a narrow panel these three drop to icons and the row scrolls sideways; nothing is cut off. The legend head repeats the quantity and the load state in words.
Switching to Results returns to the quantity you looked at most recently that this viewer can draw.
The settings sheet
Style and Display open one sheet docked at the viewer's right edge, over the edge in a narrow panel. It stays open while you work on the model; click the button again or Close settings to put it away.
- Style is how the result is drawn: Deformed shape, Undeformed ghost and the deformation Scale, the member Diagrams, the Contours with their Color map, the Color scale, the 3D diagram, Pin overall max & min and Mark singular points.
- Display is what the scene shows: every layer, label and piece of scene furniture in one list, with Search options… at the top.
Switches
The bar along the bottom edge of the canvas carries the switches you keep at hand, each with its name. There are two sets: one for a viewer showing the model, one for a viewer showing results. Pin and unpin a switch with the pin on its row in the Display sheet; Toolbar for chooses which set you are editing, and Restore default pins puts it back. Pins are kept per browser, for every viewer and project. When the bar runs out of width the switches drop to icons, and then the rest goes behind More switches, which opens the Display sheet.
A switch that has more to it than on and off carries a small arrow. The arrow opens that layer's own rows in a popover over the bar: the arrow on Loads gives Load color, Load size, Load values and Load label. Reset, shown once something has changed, puts just that layer back to its defaults; All display settings opens the sheet at the same group. There is one arrow per family: Load values has none of its own while Loads has one.
The right end of the bar holds the visual style, the deformation scale while a deformed shape is shown, and Display states.
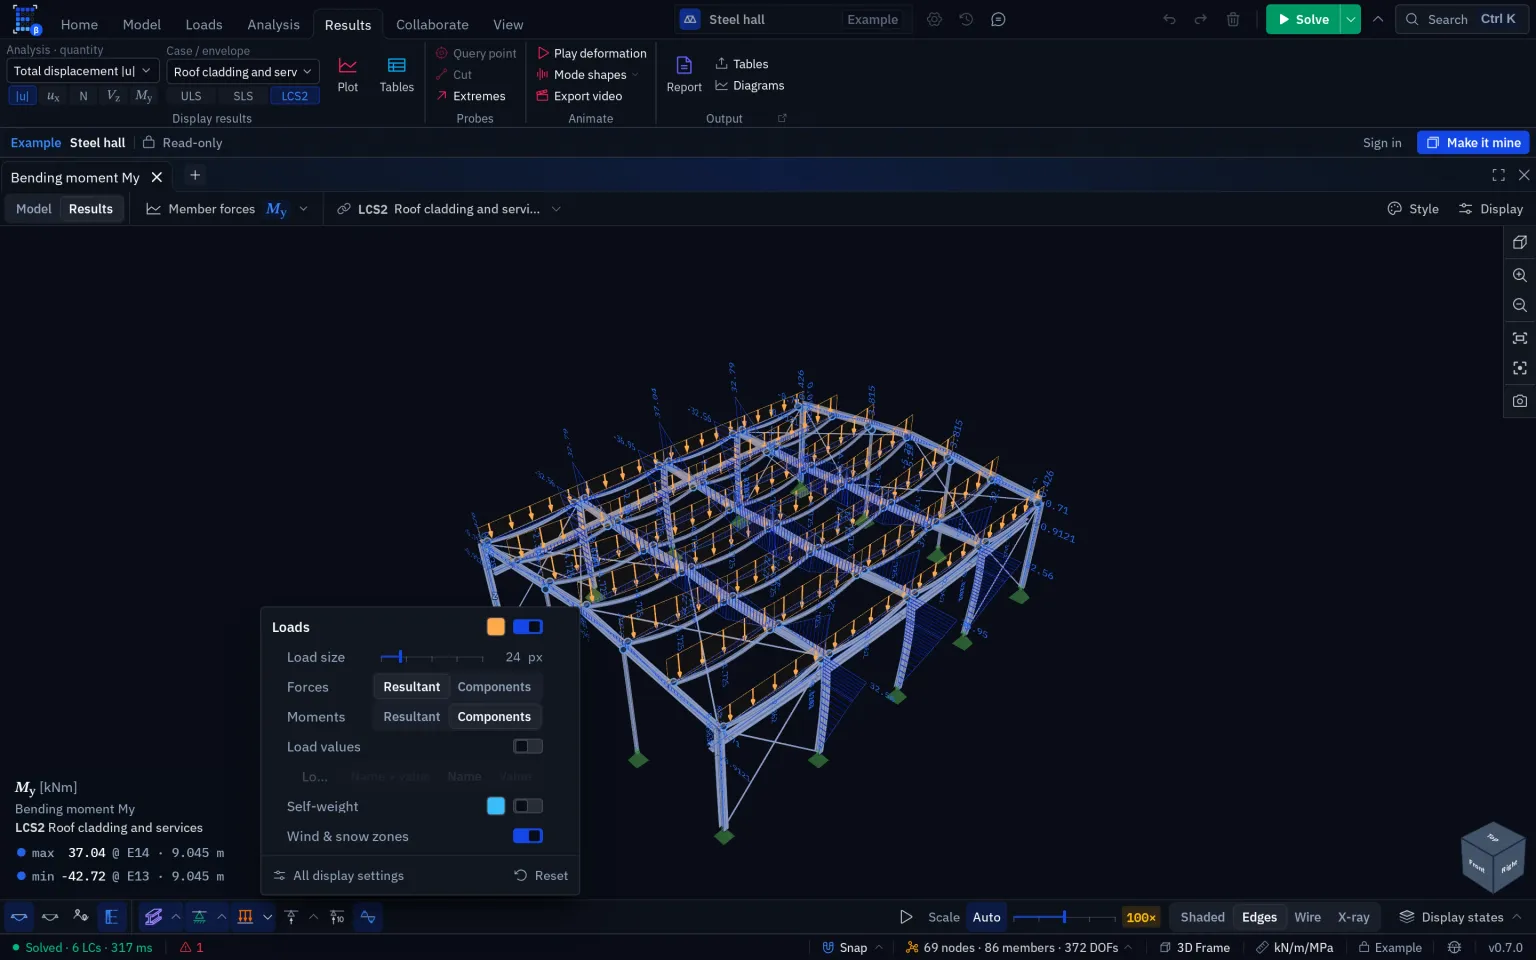
Hide and isolate
Hiding is per viewer and never touches the model. Right-click a selection and choose Hide to take it out of this viewer, or Isolate to show only it. View › Visibility has the same commands for the viewer you last clicked in. A chip on the viewer counts what is hidden, … hidden · Show all, and Show all brings it back.
A node hides once no visible element uses it, and loads, supports and results follow what they sit on. Fit, snapping, the colour scale and Select all leave hidden parts out, so a scale reads the part you are looking at.
The result board
The quantity cell on the strip, and Analysis · quantity on the Results tab of the ribbon, open the result board: the analysis, the family and the quantity on one screen.
- Along the top, the analyses as chips and Find a quantity…, which searches every family as you type. A viewer also offers the mechanisms a solve found.
- On the left, the families: Deformation, Member forces, Plate forces, Plate stresses, Error estimate, Mesh quality and Design checks. The family holding the viewer's current quantity shows its symbol beside the name.
- On the right, the family. A small one is a row of captioned tiles, such as ux along X. A plate family is a matrix under worded column heads, so the face stresses read as two faces by six components.
- Underneath, an explainer for the quantity under the pointer: a sketch of what it means (Node, global axes, Member cut, local axes, Plate element, z down or Plate mesh), its full name, its sign rule, and its range in the viewer's own load state.
The arrow keys move through the tiles by position.
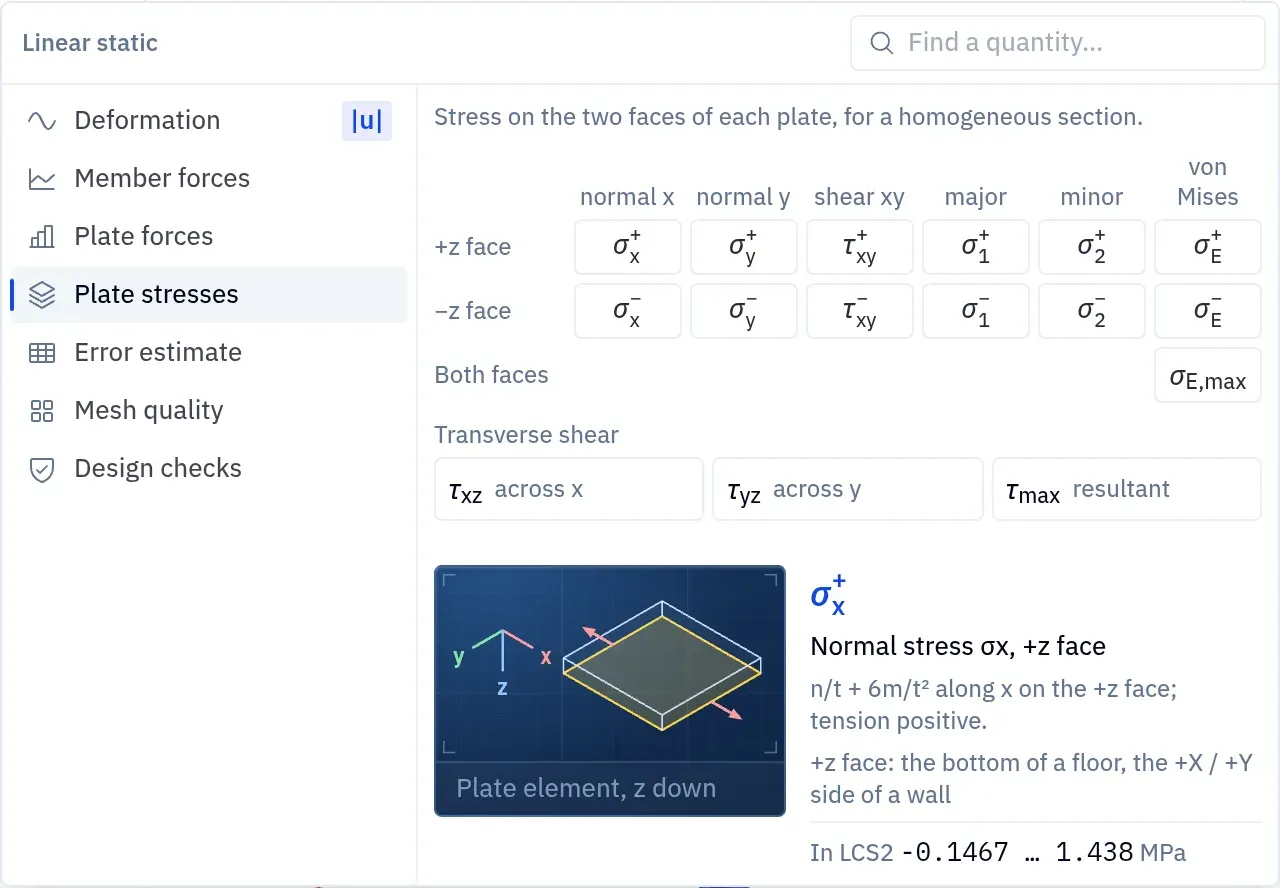
Displacements read , , , , , and on the board, as everywhere else. The command palette (Ctrl K) still finds the older names Dx, Ux, Rx and |D|.
Tabs or tiles
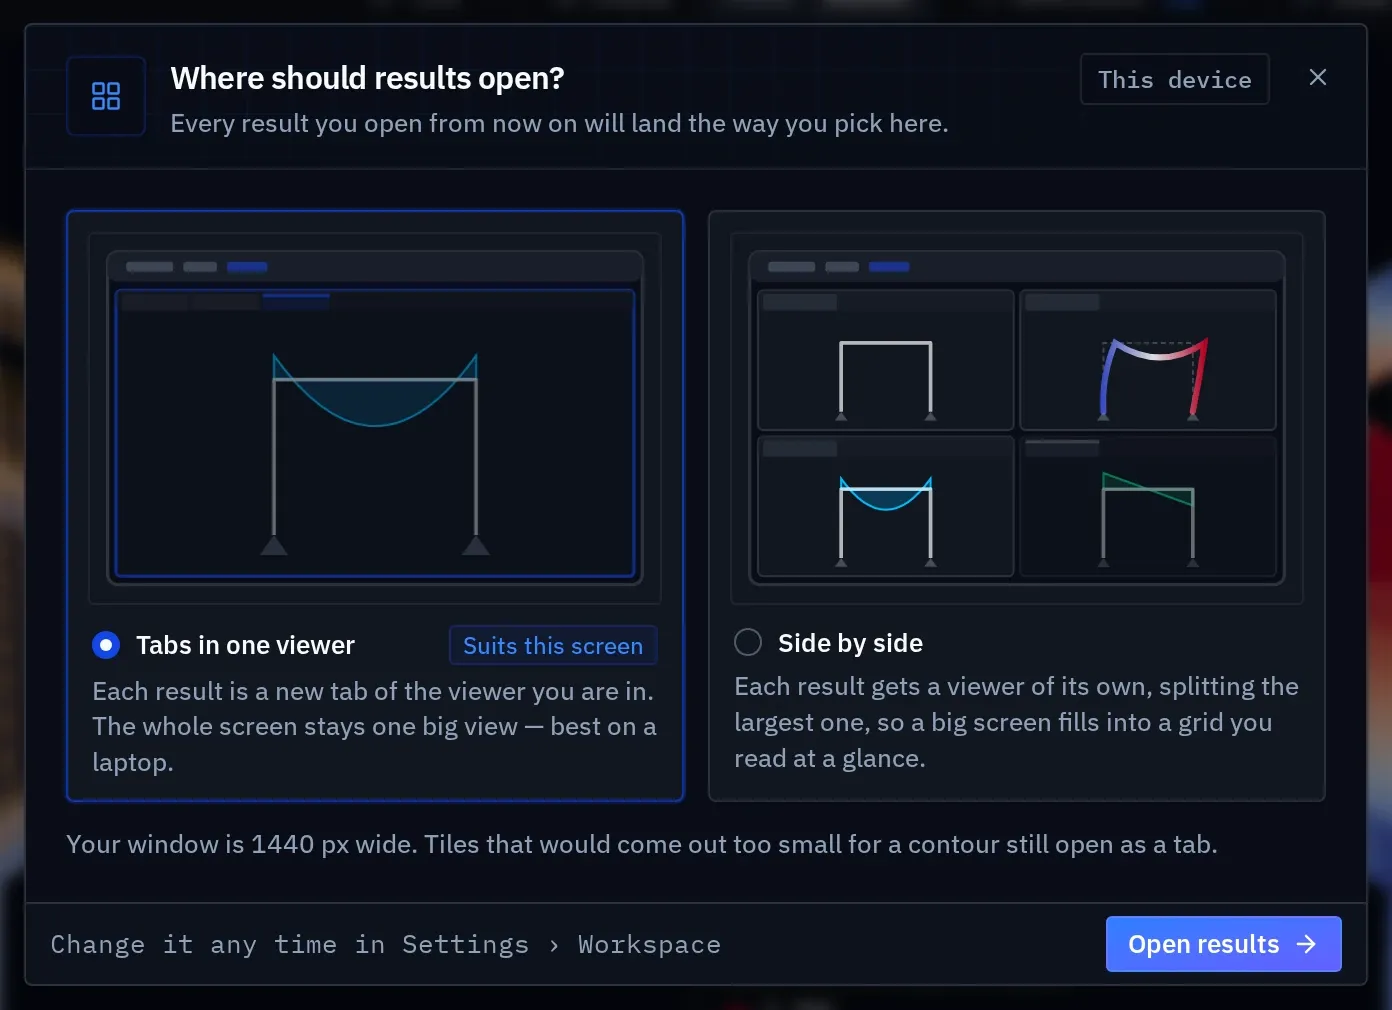
The first time you open a result, from the Results tab, the analysis dialog or a mode shape, Elementarium asks Where should results open?
| Choice | What happens |
|---|---|
| Tabs in one viewer | Each result is a new tab of the viewer you are in. The screen stays one large view. |
| Side by side | Each result gets a viewer of its own by splitting the largest viewer along its longer side, so repeated opens build a grid. A split that would leave a viewer narrower than 360 px or lower than 240 px opens as a tab instead. |
Suits this screen marks Side by side in a window 1680 px wide or more, and Tabs in one viewer below that. The answer is kept per browser. Change it in Tools › Settings…, pane General, under Workspace › Open results.
Linked viewers
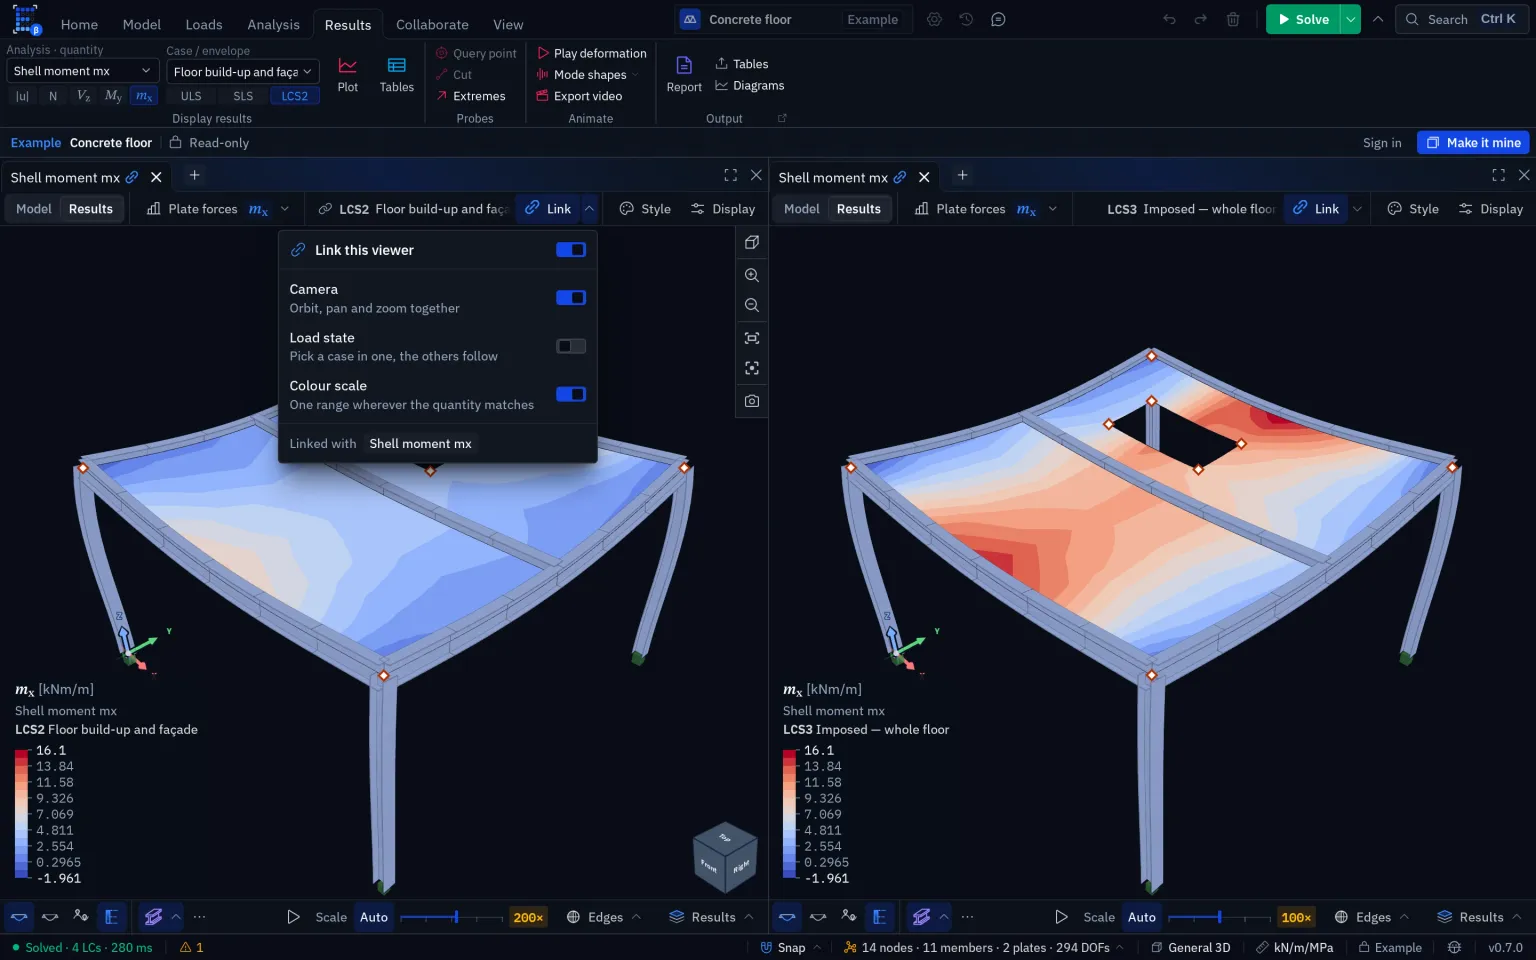
With two or more viewers on screen, the strip carries Link. Tabs of one viewer have nothing to link, so they do not show it.
- Click Link with nothing linked and every viewer on screen joins. The one you clicked leads: the others take its load state and its camera.
- Click Link on another viewer while a link exists and it joins, taking the link's load state and camera.
- Click Link on a linked viewer and it leaves. A link of one is no link: when only one viewer is left, it is unlinked too.
A linked viewer's tab carries a chain. There is one link per screen. A viewer in a background tab, or behind a maximised panel, is not drawn into a new link.
The arrow beside Link opens Link this viewer and what linked viewers share:
| Switch | What it does |
|---|---|
| Camera | Orbit, pan and zoom together. 3D viewers only. |
| Load state | Pick a case in one, the others follow. Only your pick travels: a viewer that cannot show it keeps its own. A viewer showing the model follows load cases only. |
| Colour scale | Viewers showing the same quantity colour it over one range, the envelope of their own ranges, and share the legend limits. The same colour is then the same number in each. |
All three are on by default. The choice applies to the whole link and is kept per browser. When Colour scale is on but no other linked viewer shows this quantity, the Link cell carries an amber dot and the popover says Colour scale not shared.
To compare two load cases on one scale, open the same quantity in two viewers, link them, switch Load state off and keep Colour scale on. Each viewer keeps its own case; both colour over the larger range.
Without a link, Ctrl drag in a 3D viewer drives the other viewers' cameras for as long as the drag lasts.
Copying a look
Display states, at the right end of the switches bar, names the state the viewer is in and switches the whole viewer to another. Four are built in: Modelling, Load check, Results and Report figure. Save current look as… adds your own; they are kept per browser and offered in every viewer and project.
With other viewers of the same kind open, 3D to 3D or 2D to 2D, the menu also has Copy this look to, listing each of them and Every other viewer (n). It copies the display settings: layers, labels, sizes and colours. It does not copy what is plotted, the load state, the camera or the Style settings, so the colour map and the contour style stay as each viewer had them.
Legend limits
A contour's colour scale runs from the smallest to the largest value of the result. Set either end yourself:
- Type it. Hover an end value of the legend and click the pencil, Set the top of the scale or Set the bottom of the scale. Type the value in the units the legend shows. Enter applies, Esc cancels, and an empty field hands the end back to the results. The top must be above the bottom.
- Drag it. Grab an end of the bar and drag. A line and its value follow the pointer; letting go applies it. An end cannot be dragged more than 90 % of the way to the other.
An end you set carries a pin. The × beside it, Follow the results again, releases it; Reset the scale's limits in the legend's right-click menu releases both. Values past a limit take the end colour.
The real peak is still shown. Past a limit that cuts it off, the legend prints the largest or smallest value with an arrow, so a clipped scale never hides how far the result goes.
Limits are kept per quantity: a limit on does not apply to , and coming back to finds it where it was left. Linked viewers that share the colour scale share the limits too.
Colour maps
Each viewer picks its own map: right-click the legend and choose Color map, or use Color map in the Style sheet. Reverse flips it end to end for that viewer. New viewers use Cool–Warm.
| Group | Maps |
|---|---|
| Engineering | Jet, Rainbow, Turbo, Traffic light |
| Sequential | Viridis, Grayscale |
| Diverging | Cool–Warm, Blue–Red |
| This project | The maps you make, saved with the project |
A sequential map suits a quantity that only rises, such as or a utilisation. A diverging map has a neutral middle and a hue for each sign, which suits a moment or a stress.
Making a map
Edit color maps…, at the foot of either map list, opens the Color maps dialog.
- Start from a map. Built-in maps are fixed: select one and click Duplicate, or New color map, which starts as a copy of the selected map. A new map is a draft until you click Create.
- Place the stops. Drag a stop along the gradient bar, click the bar to add one, or use Add stop. Each stop has a Color and a Position in percent. Two stops at one position make a hard edge: the colour jumps there instead of blending. A map needs at least two stops.
- Tidy it. Reverse flips the map's stops; Even spacing spaces them evenly and keeps their order.
- Choose the blending. RGB blends straight between two colours and keeps a white or grey middle neutral. HSL blends around the hue wheel and keeps a spectrum saturated. Banded (16 bands) previews the map as banded contours.
- Use it. Use in this view puts the map on the viewer the dialog was opened from.
A project map is saved with the project and shared with everyone working on it. Viewers using it repaint as you drag a stop, and every change is one undo step. A map never changes a result. Deleting one with Delete… switches the viewers using it to the default map; undo brings it back.
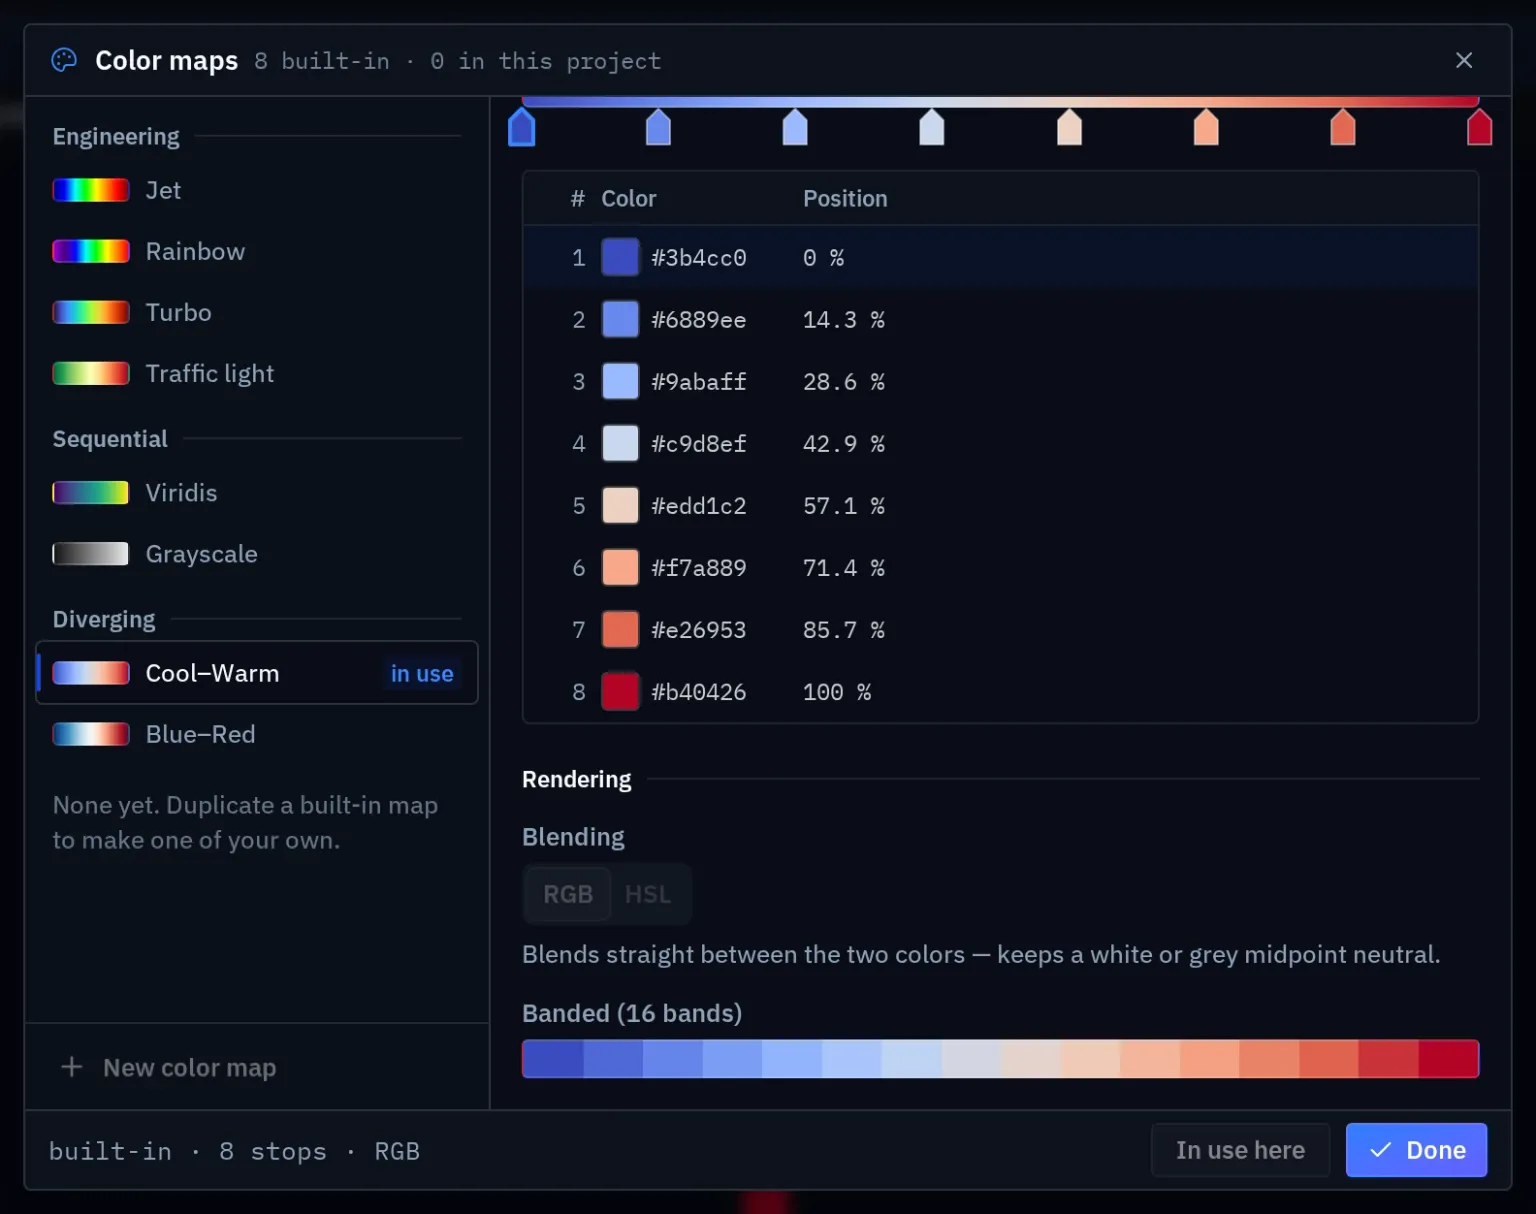
Plate results as a 3D surface
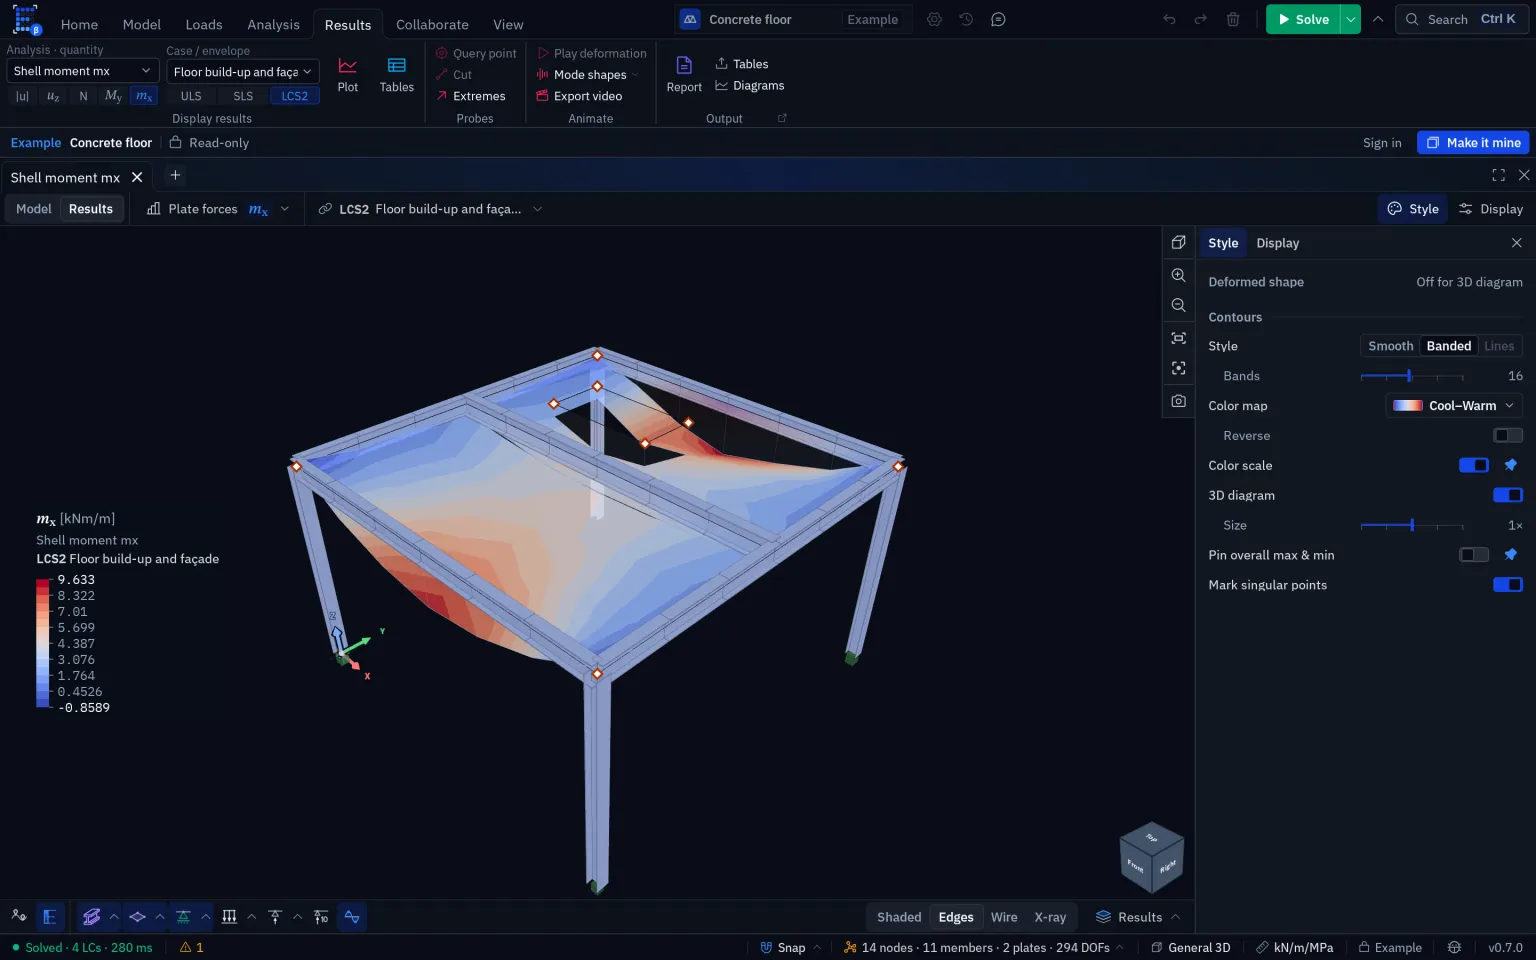
A plate contour shows a result as colour. 3D diagram in the Style sheet also draws it as a surface lifted off the plate, the two-dimensional counterpart of a member diagram. It is offered in 3D viewers for plate forces and plate stresses.
- Positive values are drawn on the side the result frame's points to. Under a floor, whose points down, a sagging moment hangs below the slab, on the tension side, as the member diagrams do.
- The surface uses the contour's own colour map, range and bands, so its height and its colour give the same number.
- Size scales it from ¼× to 4×. At 1× the peak is a tenth of the model's diagonal, the rule the member diagrams use. Double-click the slider to return to 1×.
- The plate under the surface is dimmed and keeps its contour.
- Hover the surface to read it. A query point placed from there lands on the plate.
The surface is drawn on the undeformed plate. While it shows, the deformed shape is held off and its row reads Off for 3D diagram; your setting is kept and returns when the 3D diagram is switched off.
Something wrong or unclear on this page? Tell us, and it gets corrected.